Preview
See Palimio from the inside
A visual walkthrough of a few sections.
Want to try it yourself? Get in touchand we'll set you up with your own data.
This is just a fraction of the breakdowns available in the dashboard.
01
Overview Dashboard
Your headline KPIs, content mix breakdown, and posting cadence at a glance. See total followers, median views, engagement rate, and how your output splits across topics and formats.
- KPI cards: followers, avg views, median views, engagement rate
- Pie charts for top content topics and formats
- Posts by day of week and time of day

02
Content DNA
Every post tagged across six creative dimensions. The bar chart ranks features by median views, and the hit-rate panel shows which ones consistently beat your account median.
- Top Features by Dimension: topic, format, tone, hook, scene, production
- Toggle between median views and total posts
- Hit Rate panel: which features over-perform reliably
- Winning Recipes: best-performing feature combinations


03
Competitor Benchmarking
A full roster of your competitors with side-by-side KPIs, plus dimension-level breakdowns showing exactly where they beat you and where you lead.
- Per-competitor roster: median views, engagement, cadence, top format + topic
- Dimension Performance: grouped bars comparing you vs competitor pool
- Content Gaps: ranked list of features where competitors outperform you
- Performance Scatter: every post plotted by views and engagement


04
Content Galaxy
A semantic map of your content library. Posts are clustered by similarity so you can see which themes you lean on, which are crowded, and where the whitespace is.
- UMAP-projected 2D map of all posts
- Auto-labelled clusters at macro and micro level
- Hover any dot for the full post card with feature pills

05
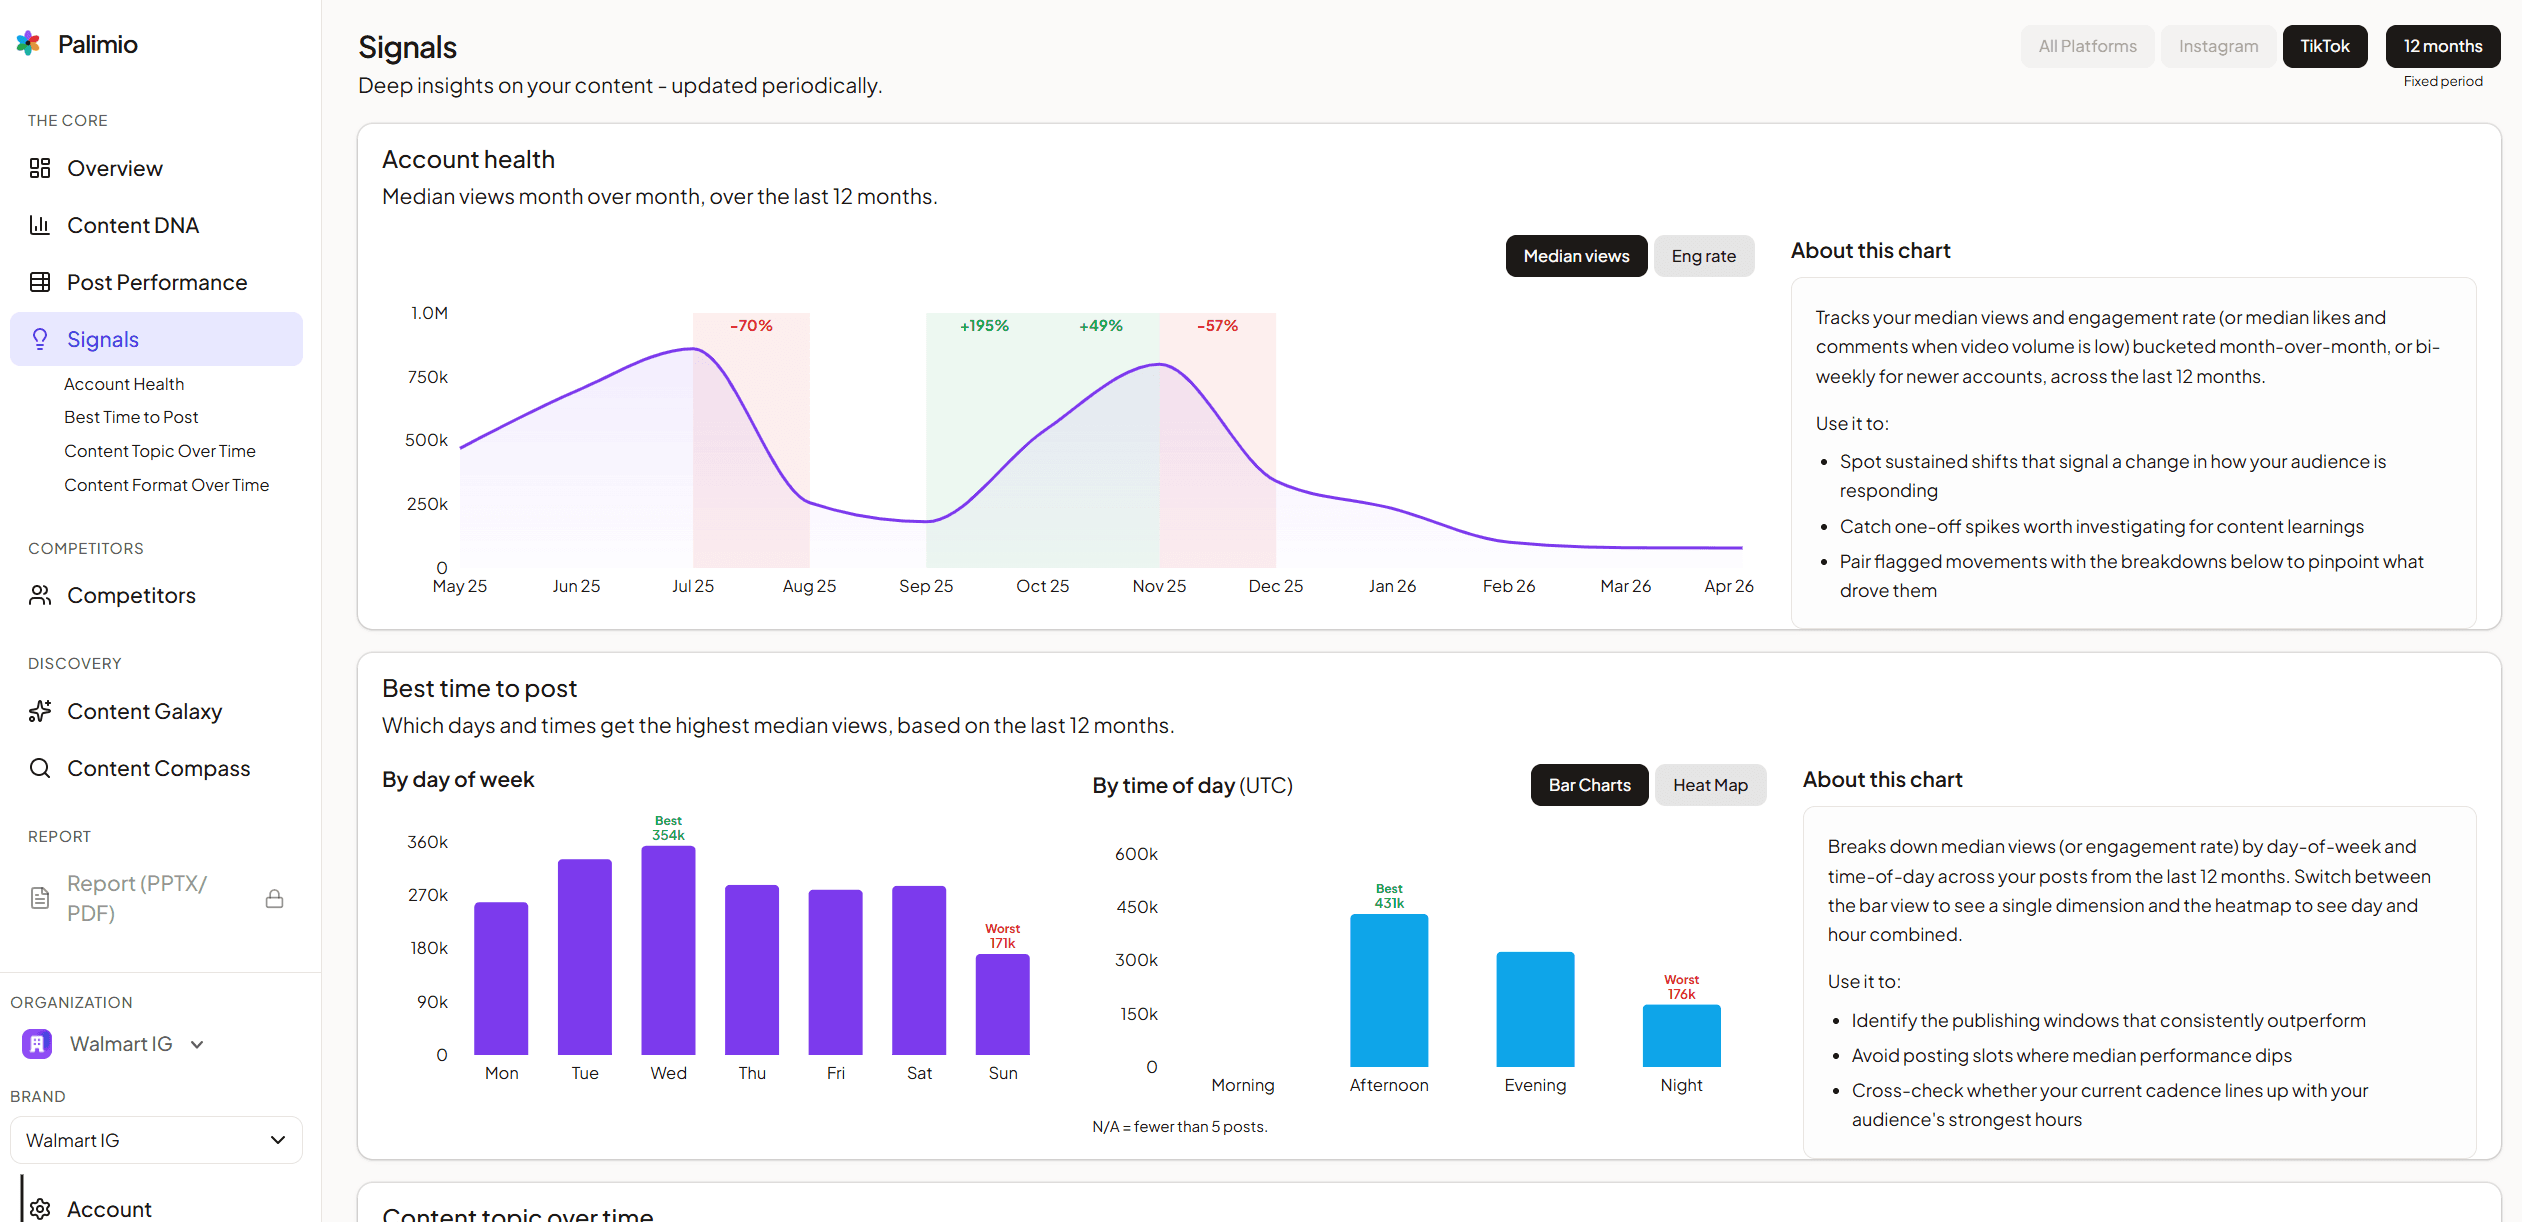
Account Health
Account health tracks your trajectory month over month with automatic shift detection.
- Account Health: trend chart with shift highlights
- Structured output: every insight has a 'What's Happening' narrative
- Topic and format performance tracked over time
Ready to see it with your own data?
Every chart, every insight, every competitor comparison, built from your actual content.
Get Started