Breaking Down The New York Times’ TikTok Machine - Decoded with Palimio
News is now a competition for attention, not authority. Over half of U.S. adults get news from social media at least sometimes, and on TikTok, a story doesn’t get read - it either stops the scroll or it doesn’t.
March 9, 2026
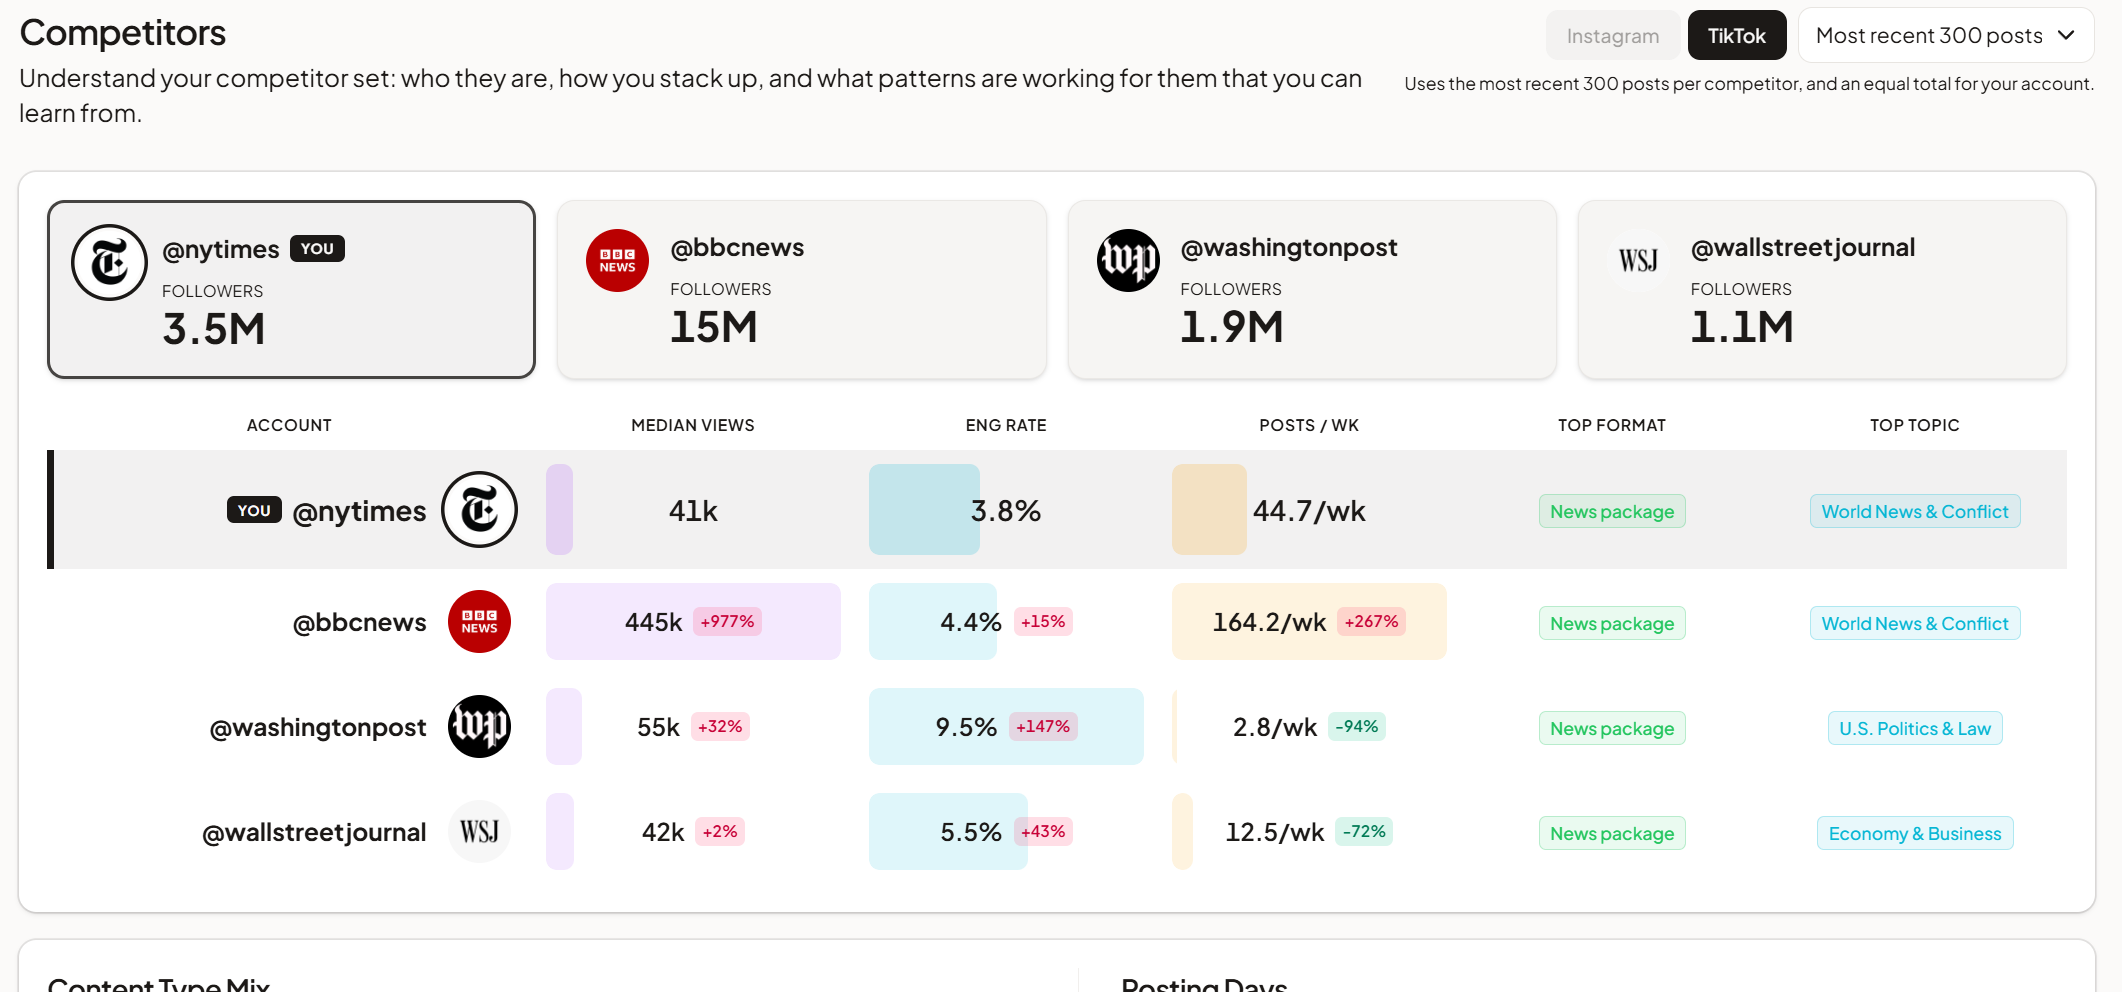
News is now a competition for attention, not authority. Over half of U.S. adults get news from social media at least sometimes (Pew Research, 2024), and on TikTok, a story doesn’t get read - it either stops the scroll or it doesn’t. The headline, the hook, the first visual frame: that’s the editorial decision now. So we ran The New York Times’ 2026 TikTok's through Palimio alongside competitors including BBC News, The Wall Street Journal, and The Washington Post to surface what’s actually driving reach.
The numbers tell a pretty clean story.
Depth beats breadth
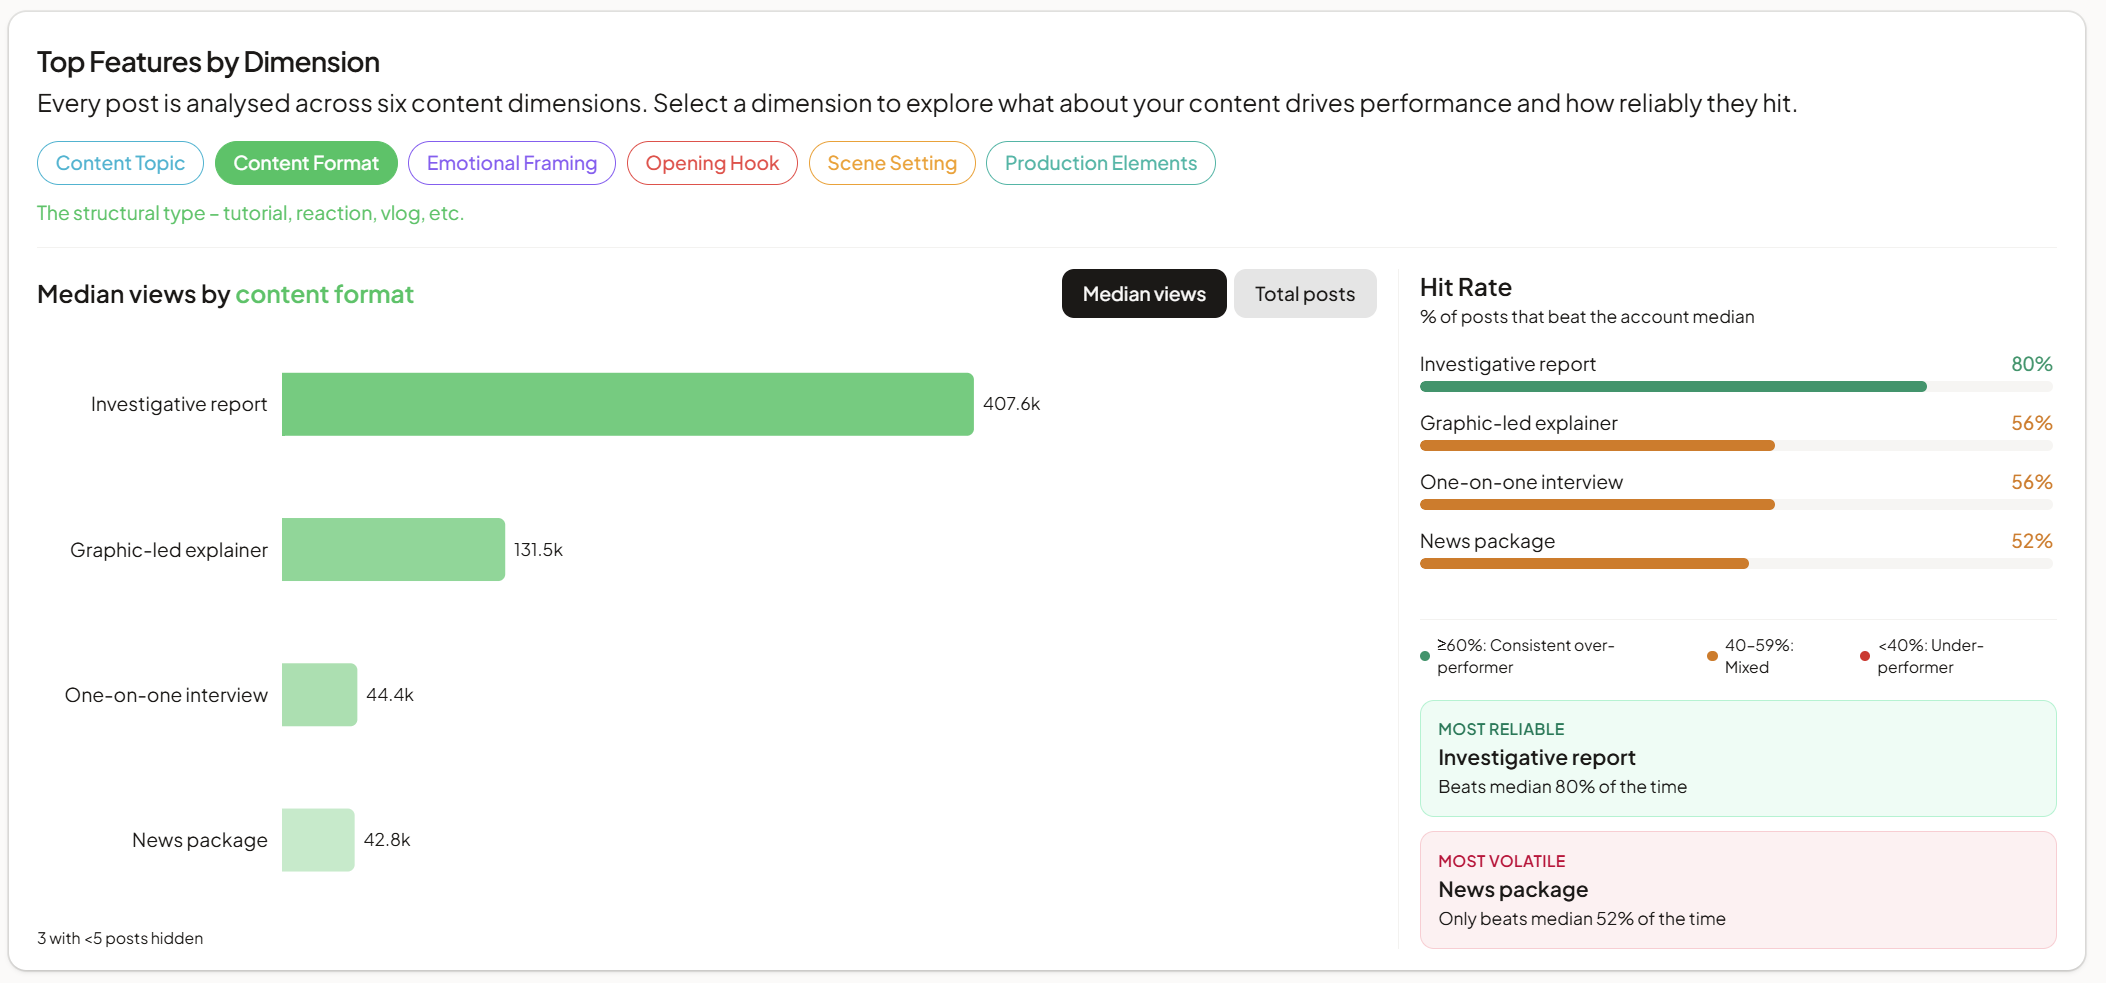
Three-quarters of NYT's TikTok feed is what Palimio classifies as News packages (broadcast-style summaries averaging 43k views). But the formats that actually break out are the ones they publish least. Investigative reports (<5% of posts) pull 407k median views. Graphic-led explainers hit 131k. One-on-one interviews sit at 44k with a 6.7% engagement rate.
The topics track the same way. Unsurprisingly, U.S. Politics & Law dominates both volume and median views (53k), followed by World News & Conflict (43k), Science & Technology (33k), and Society & Social Issues (28k). The best-performing topic is also the one their audience most wants in their feed.
Why the newsroom wants to be saved
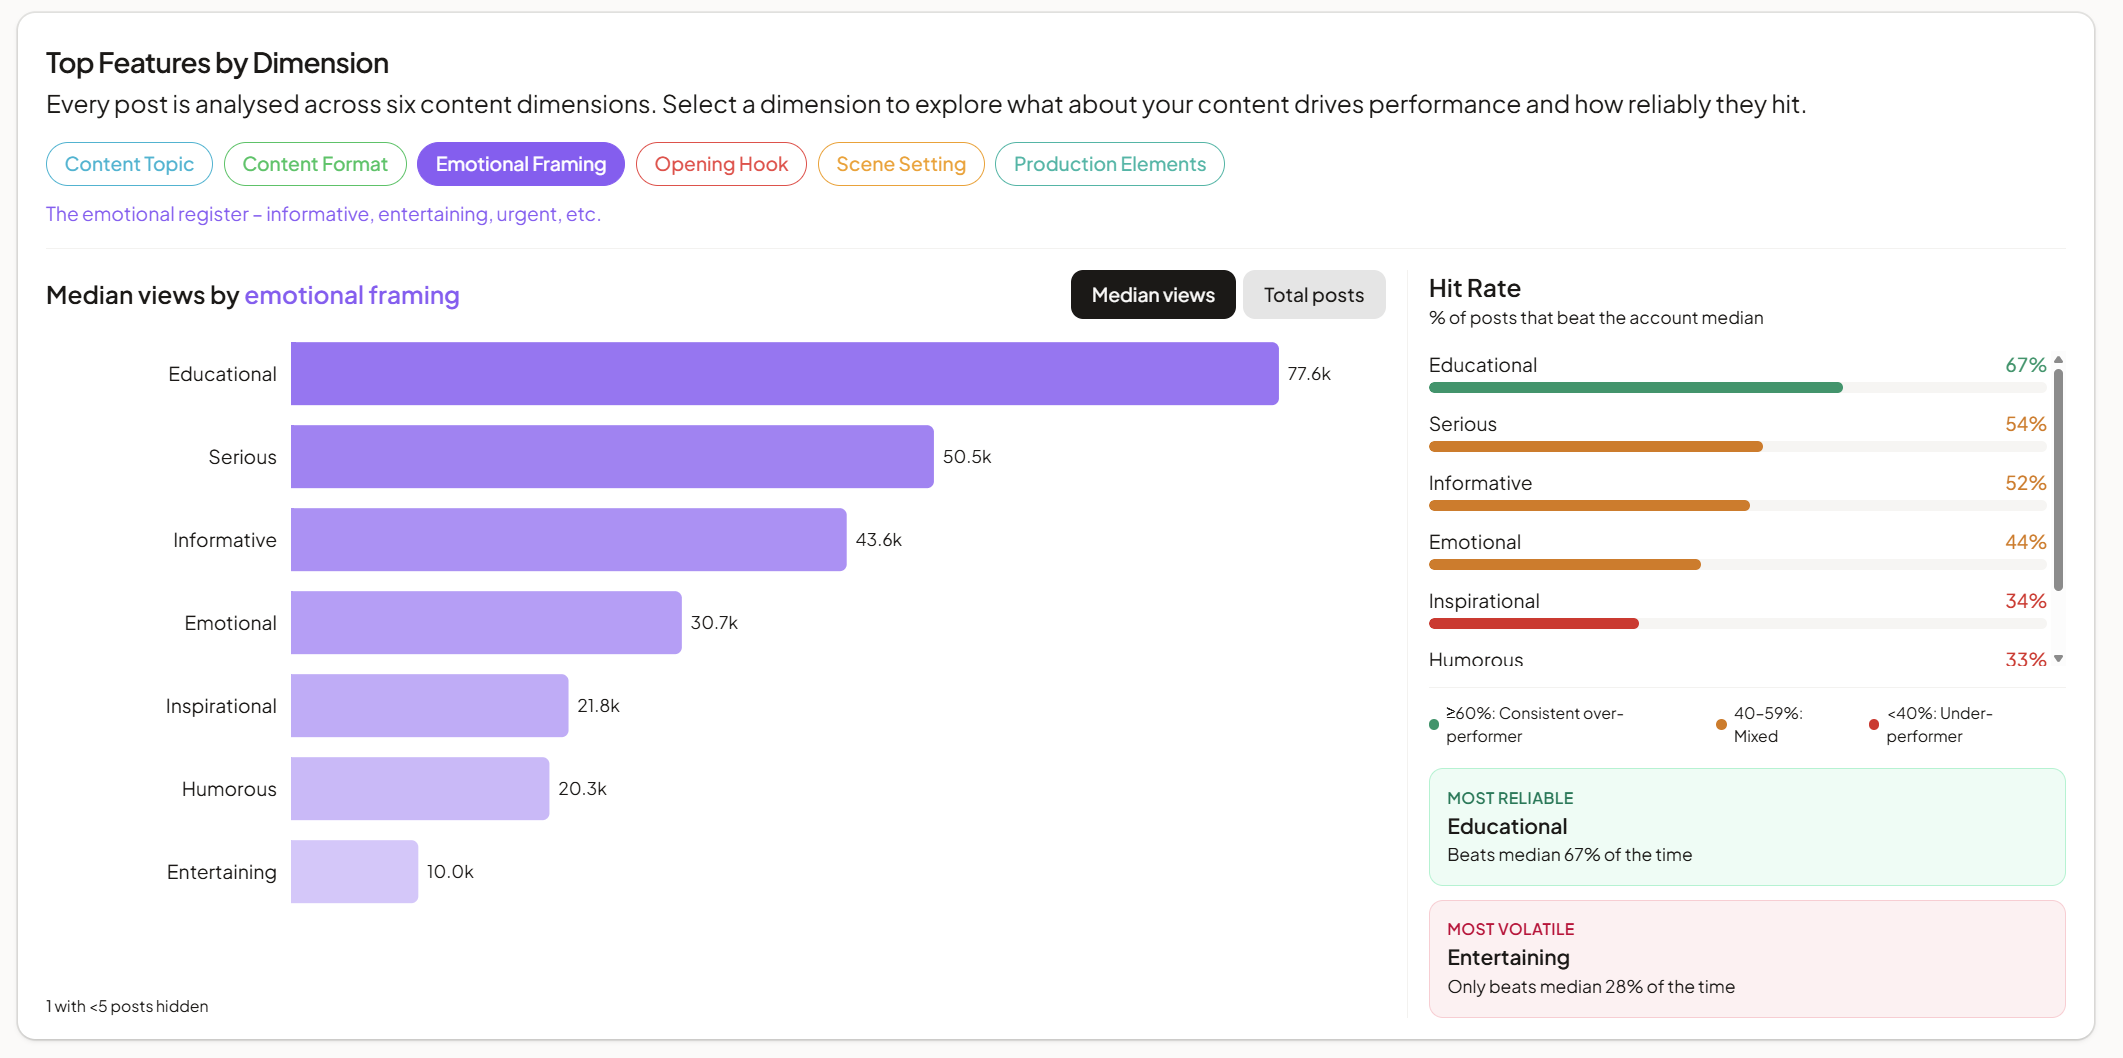
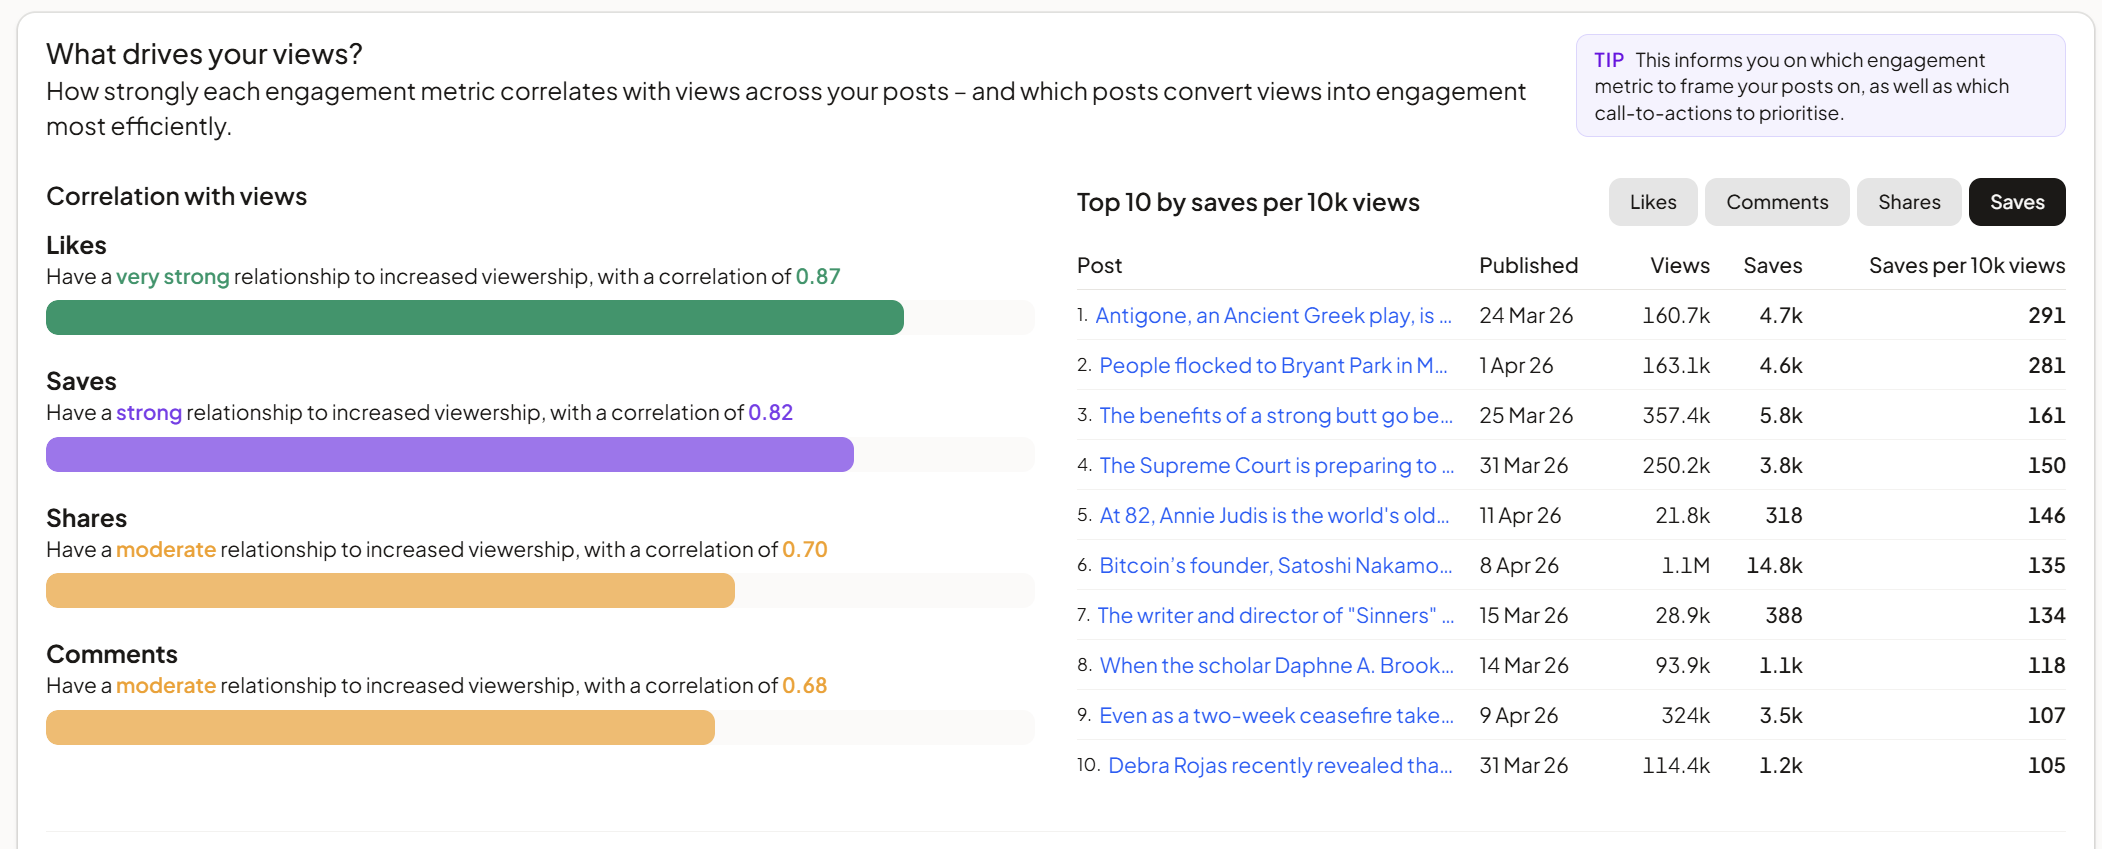
One tag cuts cleanly through the data: Educational. Posts carrying educational framing pull a median of 77,600 views against 34,000 for everything else, more than double. But the more interesting signal is in the save rate. Educational posts generate 6.4 saves per 1,000 views. Non-educational posts generate 2.6. That's a 2.4x gap in save behaviour, and it matters because across the entire NYT catalogue, saves correlate with views at r=0.82, the strongest link of any engagement metric in the data.
Saves are how the algorithm reads intent: a save says "I'll come back to this, I'll show this to someone, this is worth my time." Framing news as something worth re-watching, not just something worth knowing, is the lever. Educational content gets saved because it teaches. Teachable posts get resurfaced. Resurfaced posts reach.
Side-by-side storytelling
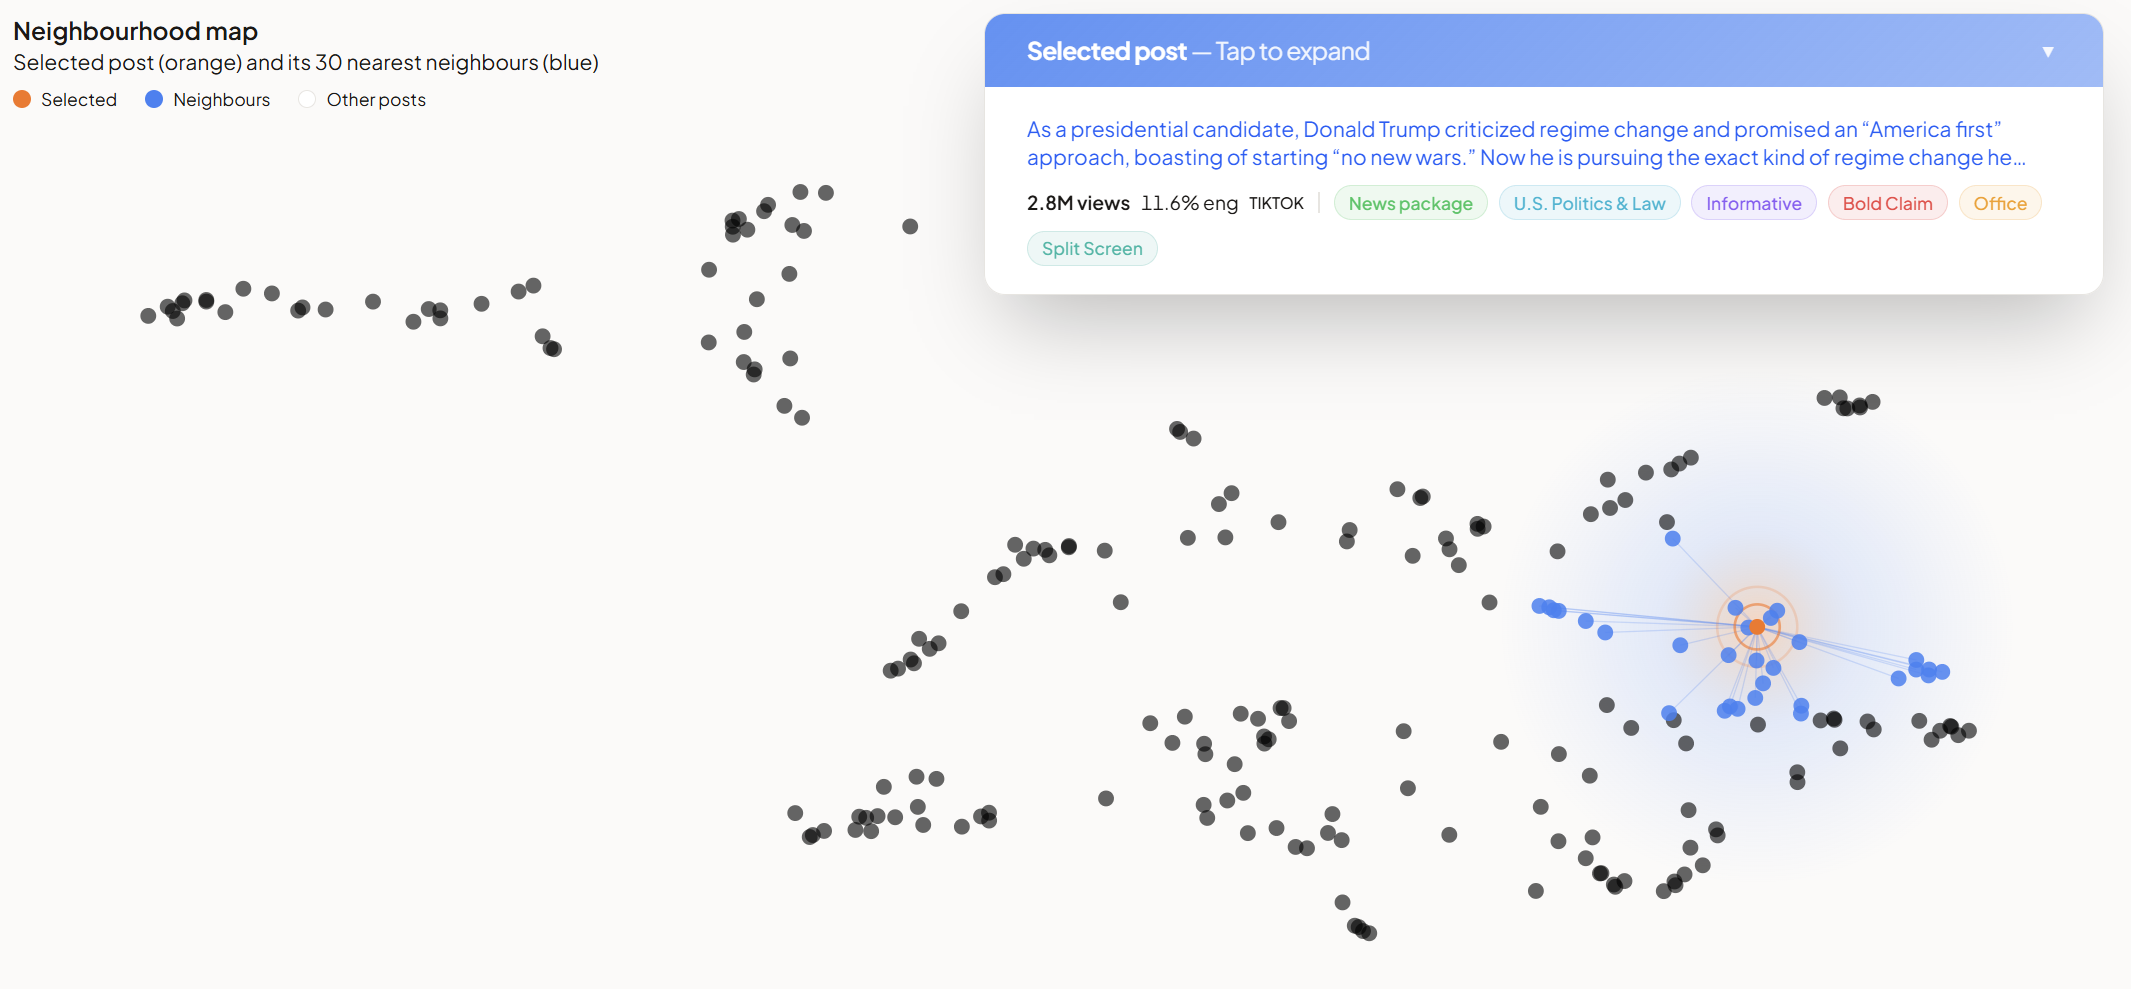
The top production element on the board is Split Screen: ~20% of posts, 52k median views, 26% above the account median. But the top line doesn't capture the real story. Sort NYT's split-screen posts by absolute views and the top seven range from 808k to 4.3M (a great example).
Split screen isn't a format, it's a receipt. The top half is the claim (headline, speaker). The bottom half is the evidence (b-roll, proof). Viewers see both sides in a single frame, which solves the credibility question before they can ask it. That's why NYT's best-performing split screens all sit in the "breaking claim" category. The format solves the credibility question before the viewer has time to ask it.
Anatomy of a hit: the Talarico primary post
The best case in the dataset: James Talarico's Texas Senate primary win. 461,900 views, a 19.5% engagement rate, four times the account average. The post hits every feature the data flags as high-performing: News package, U.S. Politics, Breaking News hook, Split Screen + Text Overlay + B-Roll + Talking Head stacked together.
But the real driver is psychological, not mechanical. It sits at the intersection of four triggers: an underdog (a seminarian beating a sitting congresswoman), an irregularity hook (Election Day rule changes creating a "something's off here" gap), record-turnout social proof, and a named villain-in-waiting in the Republican runoff setting up the next chapter.
That last one is key: the post doesn't close the loop, it opens the next one. Viewers saved it because it felt unfinished, and unfinished stories are why people come back.
What the competitors reveal
BBC News, WSJ, and The Washington Post publish 94% videos (vs images and carousels). TikTok rewards motion and they've committed. Their single highest-performing format tells the sharpest story: On-street Journalist, 618,900 median views, the best of any format across the entire competitor set. NYT has published ~1% of this format in 2026. The format puts a reporter in the middle of the event, mic in hand, eye-level with the subject, and it's doing four to ten times the median of any studio-based format. The single biggest under-exploited lever in NYT's playbook isn't a new topic or a new tone. It's sending a reporter outside and capturing exclusive footage.
This is what Palimio does.
Every breakdown in this post came from one command: connect a TikTok handle, let Palimio tag the catalogue across format, topic, tone, hook, setting and production elements, and read the patterns in plain English. No tagging spreadsheet, no analyst team, no six-figure contract. If you run a brand, agency, or creator business and want to see what's actually working in your own feed, drop us a message and we'll show you.