The Strategy Director vs. His Own Feed: A @howtohoopforever Case Study
Jack Appleby writes the creative strategy playbook for some of the biggest brands in the world. He also runs @howtohoopforever, a basketball TikTok, on the side. We ran 100 of his recent posts through Palimio. The data has opinions.
April 20, 2026
The box score
100 posts since September 2025. Median 31k views, Q3 79k, top post at 1.6M views (a 3x3 Chicago Bulls tournament clip). Average engagement rate 6.9%. Saves-to-views correlation r=0.95, practically lockstep. His audience isn't scrolling past, they're filing things for later. A strong top-of-sheet for a basketball-niche account at this volume.
Format: instincts are half right
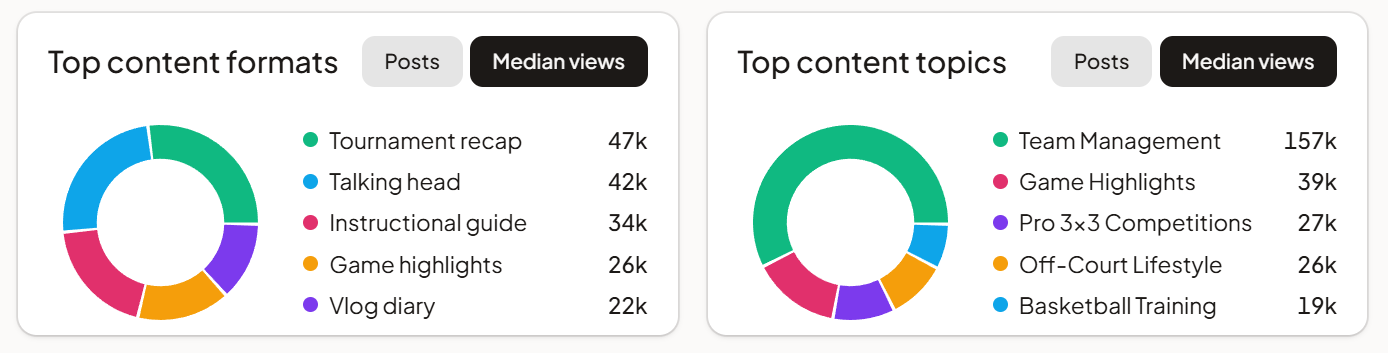
The workhorse format is Vlog Diary (35 posts, 22k median). It's the format he publishes most, and it's also his weakest. Tournament Recap (13 posts, 47.2k median) and Talking Head (29 posts, 42.2k) each do roughly 2x the work per post.
The pattern underneath is about stakes. Vlog Diary posts are built for his core followers: a day-in-the-life has no promised payoff. Tournament Recap carries a built-in narrative arc (a game happened, the outcome mattered), and Talking Head front-loads a claim the audience can either agree or disagree with in their head. Both give a random scroller a reason to stay. Vlog Diary only lands with people who are already committed, and for a 30k-median account most of the reach isn't there yet.
Topic: the money on the table
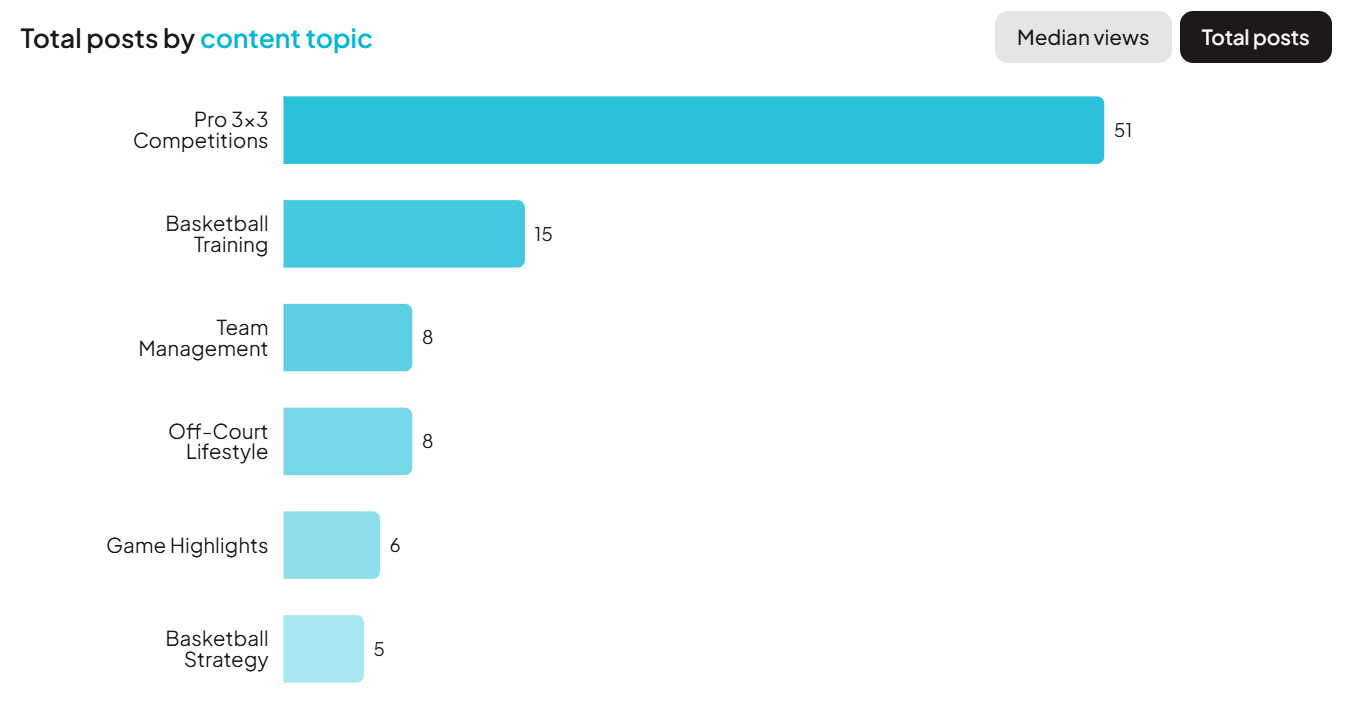
Highest-median topic is Team Management (8 posts, 131.8k median). Basketball Strategy sits next (5 posts, 91.2k). His volume topics, Pro 3x3 Competitions (51 posts, 26.7k) and Basketball Training (15 posts, 18.9k), are his lower performers. Small samples on the top two, but the signal is clean: the meta-layer (how to run a squad, how to think about the game) outperforms the footage-and-reps layer by roughly 4x.
The hook hierarchy
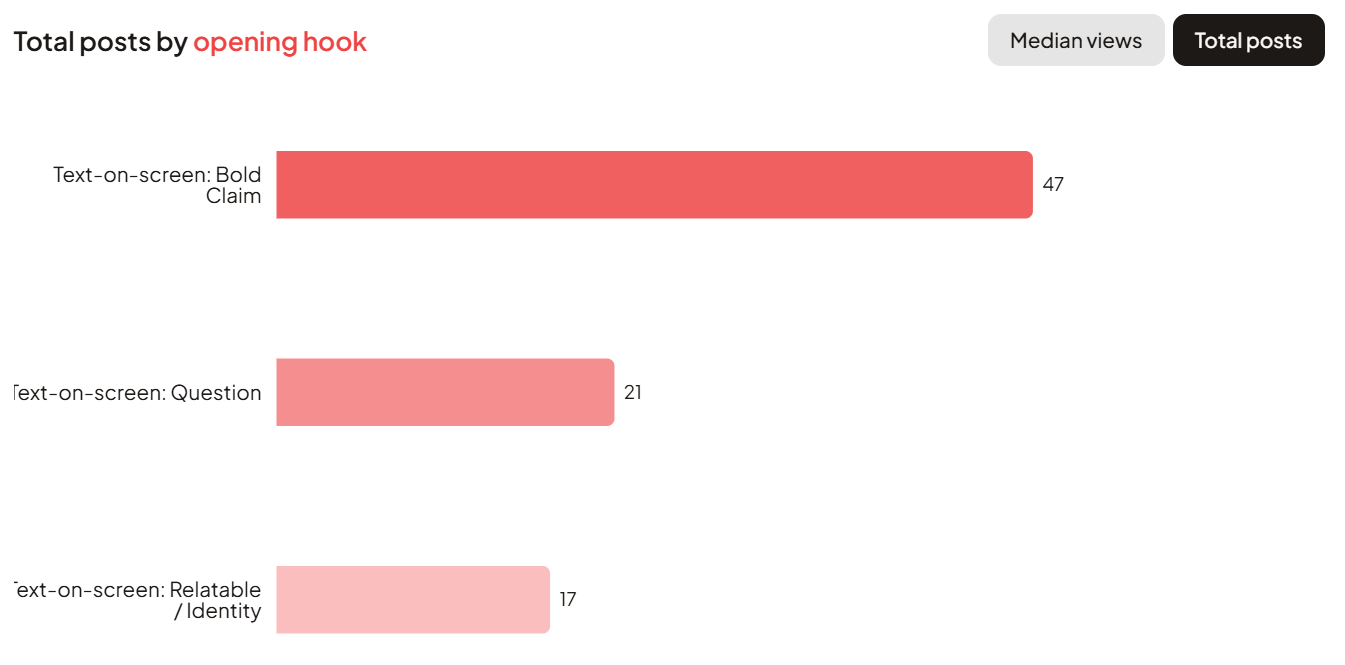
95 of his 100 posts open with text-on-screen. Inside that category:
Contrarian / Debunk: 78.9k median (2 posts, small sample) and 43 median comments, the highest discussion driver.
Question: 45.3k median (21 posts), proven at volume.
Bold Claim: 32.1k median (47 posts), the default, mid-pack.
Relatable / Identity: 18.7k (17 posts), weakest.
Tone: the Serious one is sneaking up
Most posts are tagged Entertaining (83), Fast-Paced (76), Inspirational (49), or Humorous (40). Fits basketball. But the 9 Serious-tagged posts pull 68.3k median, more than 2x the Entertaining median. Emotional (7 posts, 40.1k) also over-indexes. When he steps out of the punchline lane and takes the material seriously, the feed rewards him. Probably the most counterintuitive finding in the set.
Day + time (ET)
Best day: Monday (40.8k median, 17 posts). Worst day: Saturday (16.5k median, 13 posts). Somehow a basketball creator's worst performing day is literal Saturday basketball day. His 9am ET slot is his highest-volume hour (12 posts) but his weakest morning slot (18.9k median). 10am, 1pm, and 2pm ET consistently land best.
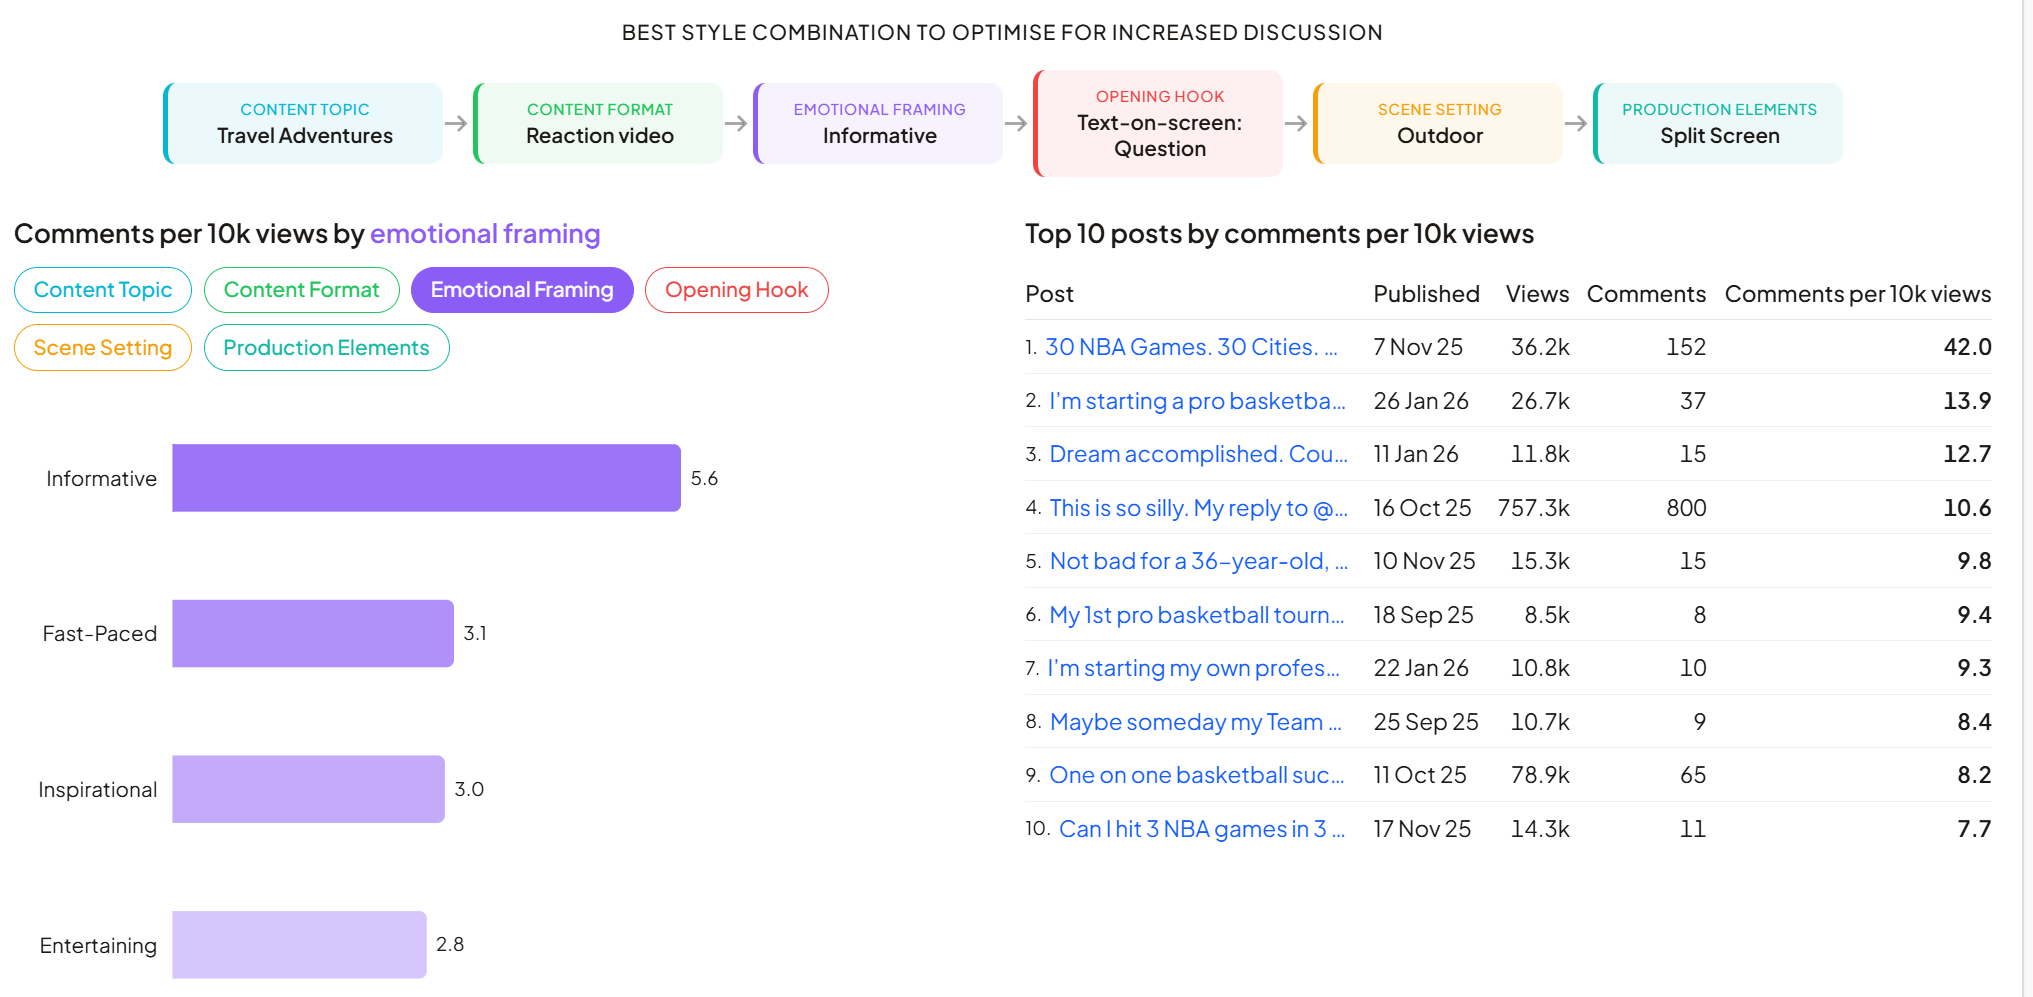
What drives discussion
Comments correlate with views at r=0.82 (likes hit r=0.98). Comments lag slightly behind reach, meaning discussion-heavy posts earn the reach they get. Travel Adventures (3 posts) has the highest comments-per-1k-views at 1.7. Team Management is a reach king but light on comments (0.29 per 1k). People save that stuff, they don't argue it.
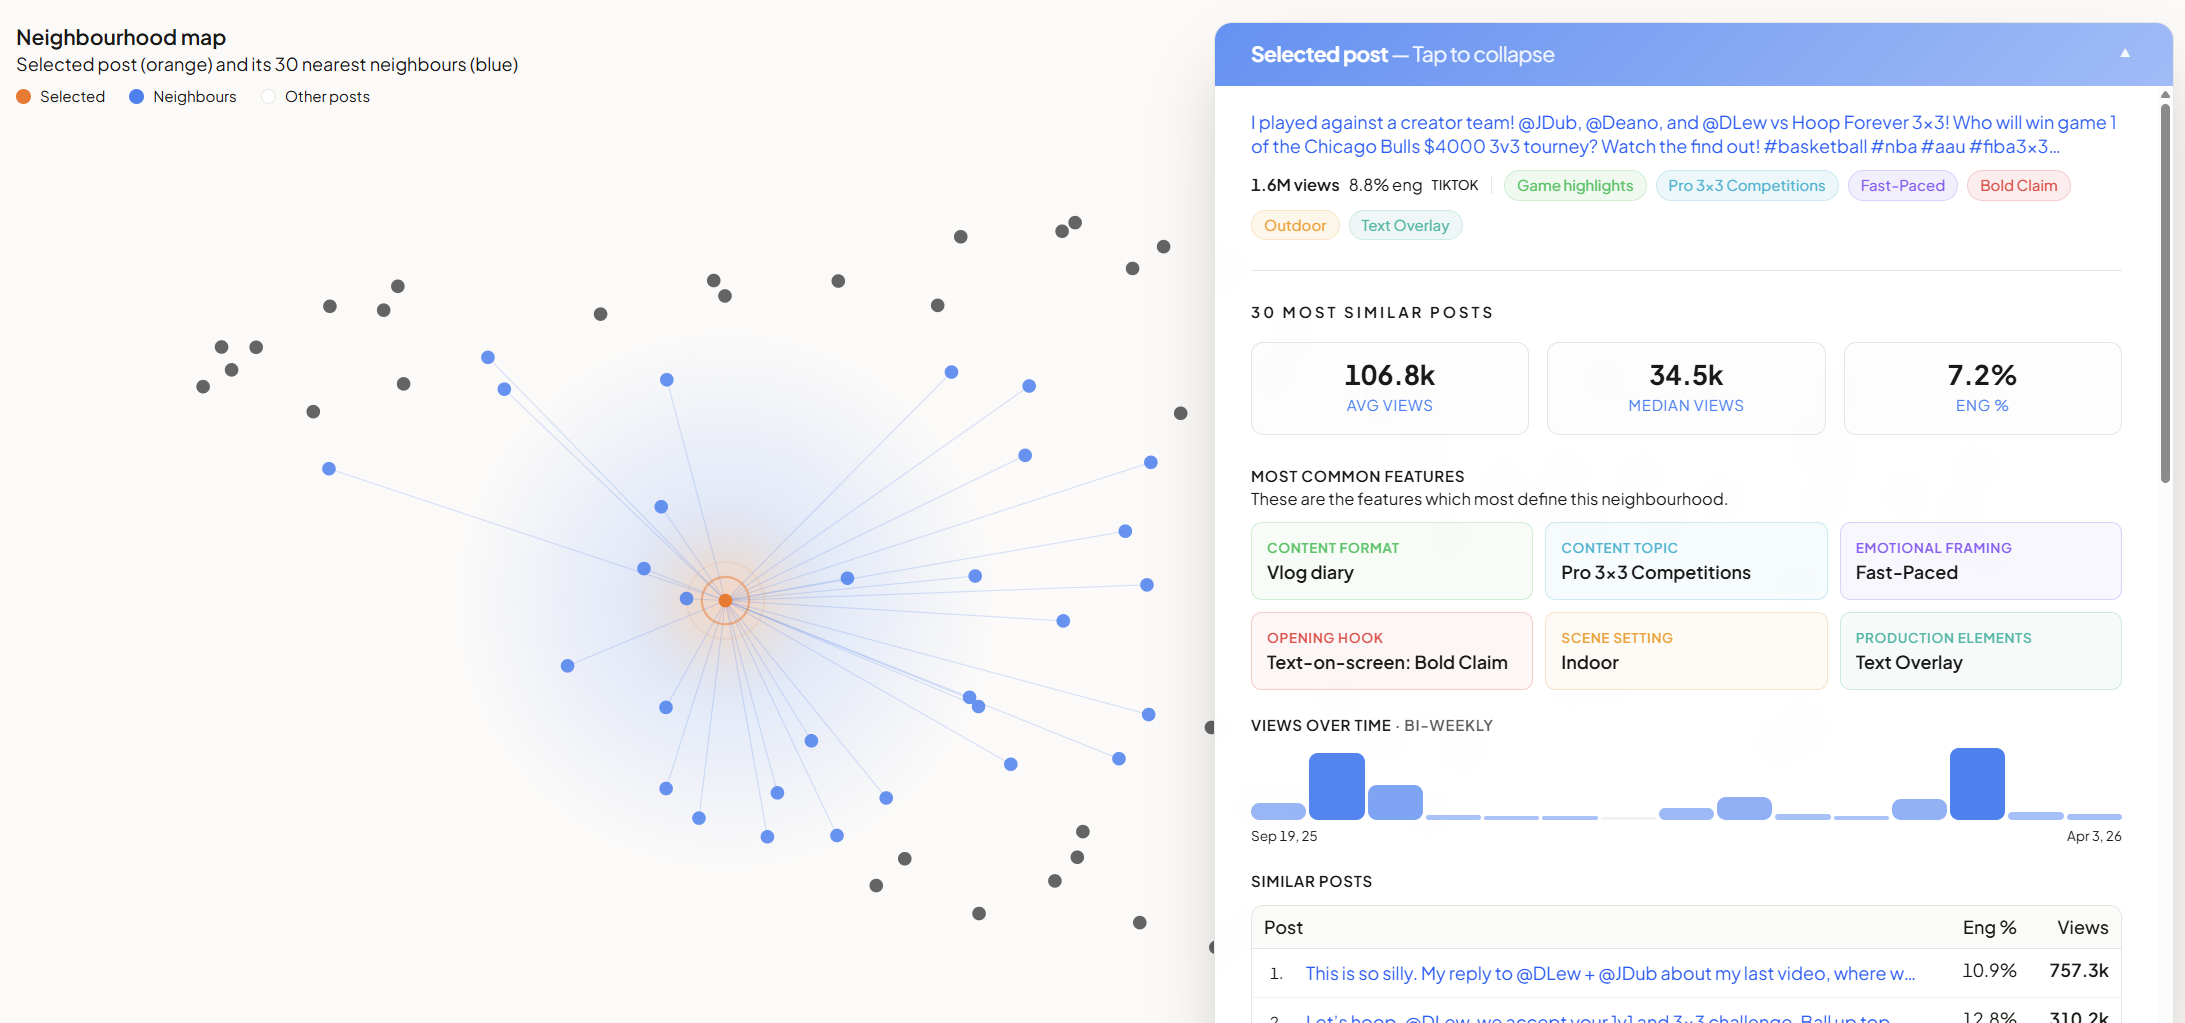
Compass: the formula inside the hit
His top post (1.6M views) was a 3x3 game against a creator team at a Chicago Bulls tournament. Palimio's Content Compass picks any single post and surfaces its 30 nearest creative neighbours in the catalogue. The neighbourhood median is 34.5k views, roughly his account median. But sort those 30 posts by absolute reach and the top six all share one thing: a named creator antagonist or personal stakes. The response to JDub and DLew at 757k. The 1v1 challenge acceptance at 310k. "Why did I crash out?" at 243k. The Thailand $10k playoffs at 532k. The winning formula isn't Game Highlights + Pro 3x3 + Bold Claim (the shared creative tags). It's Game Highlights + Named Antagonist + Personal Stakes. Compass surfaces that distinction without scrolling a hundred videos back by hand to compare.
Why this matters
Operators as sharp as Jack already know most of these patterns intuitively. Palimio's job isn't to replace that instinct. It's to quantify it, surface the exact magnitudes, and flag the cases where the intuition is directionally right but the publishing calendar doesn't yet match.
Every breakdown in this post came from a single command. Palimio ingests a full TikTok or Instagram catalogue, auto-tags every post across six creative dimensions (format, topic, tone, hook, scene, production elements), and runs real statistics on the results: medians, quartiles, outlier detection, correlation analysis.
No manual tagging spreadsheet, no analyst team. Palimio keeps the data updated, so you know exactly which way to steer each day.
If you run a brand, an agency, or a personal content account, we'd love for you to try it on your own feed.